Progression to HE Data Insights

Insights
Every year we receive data from the Higher Education Statistics Agency (HESA) in relation to the learners GHWY has engaged with through Uni Connect (and some learners in control groups). This enables us to analyse relationships between learners’ engagement in our programmes and their progression to higher education. From this analysis we identify trends and generate insights about the impact and efficacy of our programmes.
The latest version of our progression to HE analysis is available below.

Higher Progression Rates for GHWY Cohort
- GHWY participants had higher rates of progression to higher education (HE) compared to the national and regional averages.
- In 2018-2020, GHWY progression rates were significantly higher than all control groups, including a weighted national average and non-participants recorded on HEAT.
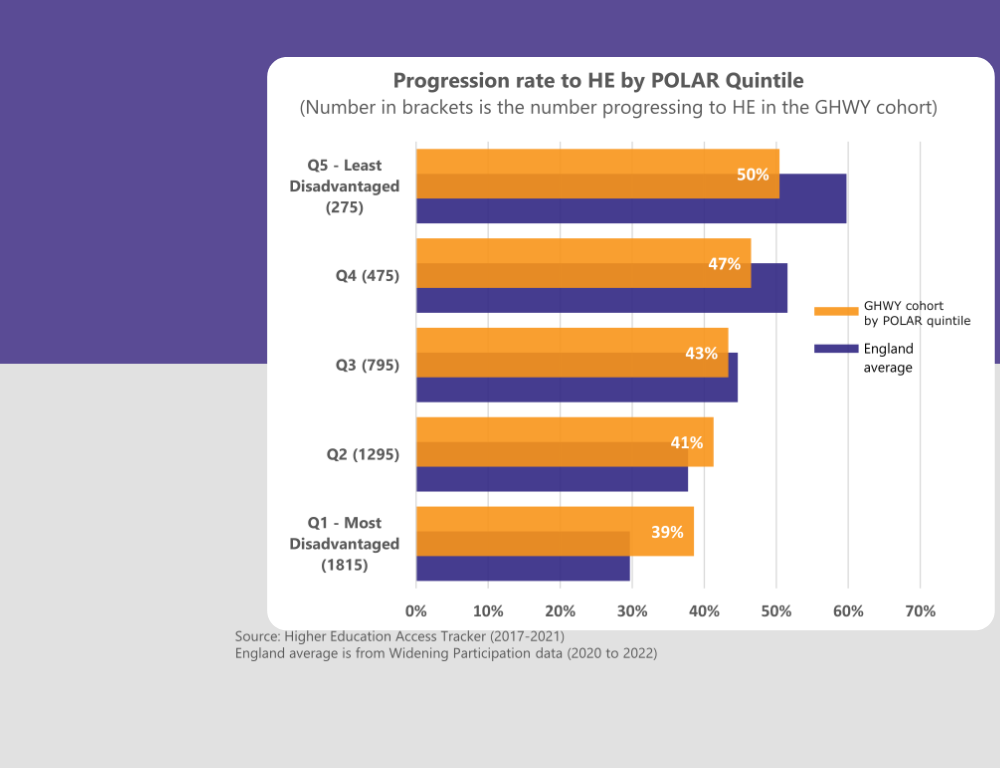
Significant impact on POLAR Quintile 1 Learners
- GHWY activities had a particularly strong effect on learners from areas with historically low HE participation (POLAR Quintile 1), tripling their likelihood of progressing to HE.

Activity type influences progression rates
- Activities like HE subject insight, summer schools, and non-student activities had the highest progression rates.
- Skills & attainment and mentoring activities showed lower progression rates.

Participation Intensity Boosts Progression
- Students participating in multiple GHWY outreach activities showed a higher likelihood of progressing to HE.
- Each additional activity increased the probability of progression by about 20%.